
One of the most common questions creators and digital marketers ask is whether their account performance is healthy. Many compare their numbers against arbitrary viral moments or unrealistic expectations, leading to unnecessary frustration. In 2026, understanding what constitutes a "good" engagement rate requires looking at empirical platform data categorized by audience size and content format.
Because Instagram's algorithm increasingly prioritizes relationship strength and private sharing (DMs and saves) over passive likes, evaluating your account's health involves more than counting heart taps.
The Two Formulas for Calculating Engagement Rate
Before comparing your metrics against platform benchmarks, ensure you are using the correct mathematical formula:
1. Public Engagement Rate (By Followers)
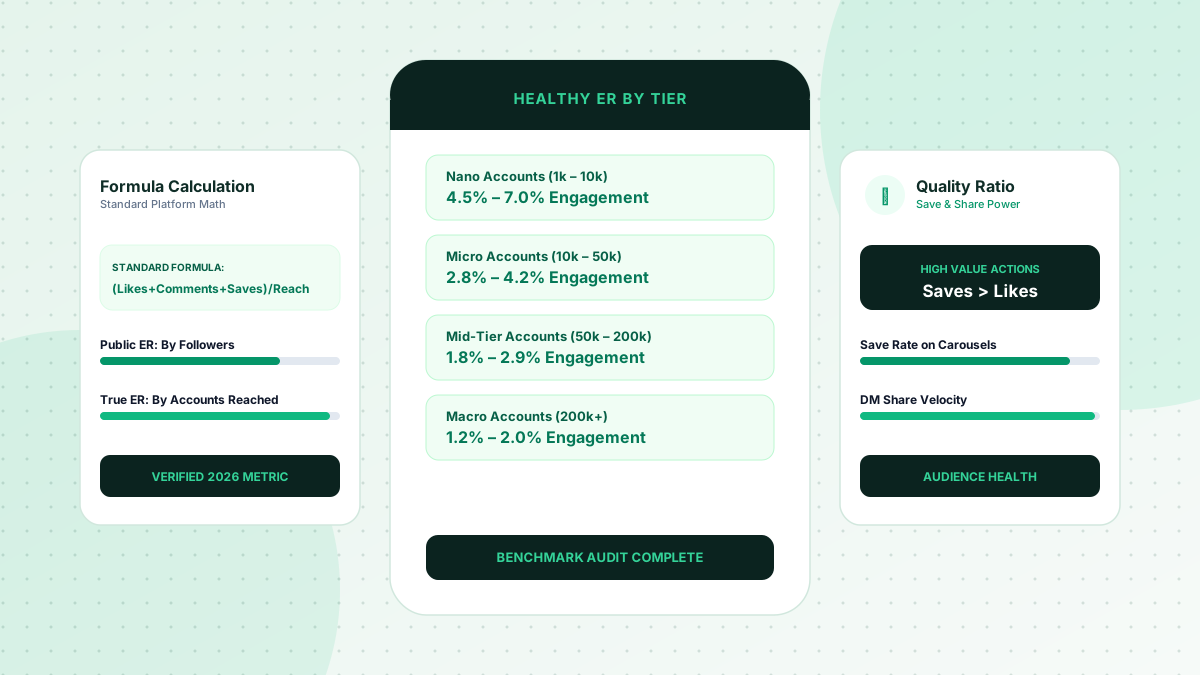
Used primarily by third-party audit tools and brand agencies assessing creator profiles: `` ER (Followers) = [(Total Likes + Comments + Saves) / Total Followers] * 100 ``
2. True Engagement Rate (By Reach)
The internal metric professional creators track inside Instagram Insights: `` ER (Reach) = [(Total Likes + Comments + Shares + Saves) / Total Unique Accounts Reached] * 100 `` Engagement by reach is a more accurate measure of content resonance because it accounts for how effectively your posts perform with the audience that actually saw them.
2026 Instagram Engagement Rate Benchmarks by Tier
As an account grows in follower volume, its percentage engagement naturally decreases due to audience fragmentation and changing feed algorithms. Here are the realistic performance bands across account tiers in 2026:
Nano Creators (1,000 to 10,000 Followers)
- Average Rate: 3.5% to 4.5%
- High Performing: 5.0% to 7.5%+
- Context: Nano accounts enjoy tight-knit community bonds where friends, family, and direct peers interact frequently.
Micro Creators (10,000 to 50,000 Followers)
- Average Rate: 2.2% to 3.0%
- High Performing: 3.5% to 4.5%
- Context: At this stage, accounts attract brand sponsorship interest. Maintaining an ER above 3.0% commands premium sponsorship rates.
Mid-Tier Creators (50,000 to 200,000 Followers)
- Average Rate: 1.5% to 2.2%
- High Performing: 2.5% to 3.2%
- Context: Reach broadens beyond core niche enthusiasts into casual lifestyle followers.
Macro Accounts (200,000+ Followers)
- Average Rate: 1.0% to 1.6%
- High Performing: > 2.0%
- Context: Even an ER of 1.2% represents thousands of active interactions per post, delivering massive commercial volume.
Why Saves and Shares Outweigh Likes
In the current Instagram ranking model, interactions carry different weights:
- Saves: High-value reference signal. A post saved by 500 users receives extended Explore distribution because it indicates durable utility.
- Direct Message (DM) Shares: The highest-weighted relationship signal. When users share a Reel or carousel via DM, Instagram prioritizes that creator in the recipient's primary feed.
- Comments: Indicates active conversation and dwell time.
- Likes: Baseline feedback that carries minimal distribution weight on its own.
3 Quick Tactics to Lift Below-Average Engagement
If your account falls below these industry benchmarks, implement these operational changes:
- Publish 2 Educational Carousels Weekly: Carousels consistently generate the highest save rates and benefit from Instagram's "second-chance" feed feature (showing slide 2 if users skip slide 1).
- Respond to Every Comment Within 60 Minutes: Fast response loops increase conversation depth and signal active account management to the algorithm.
- Audit and Prune Inactive Profiles: Inactive ghost accounts bloat follower counts while contributing zero interactions, artificially depressing your public engagement percentage.
Tracking these benchmarks monthly gives you an objective assessment of whether your content strategy is strengthening or decaying.
Use a sustainable content strategy, and compare a one-time visibility package only if its scope, price, requirements, and refund terms fit your campaign.